
 admin
admin 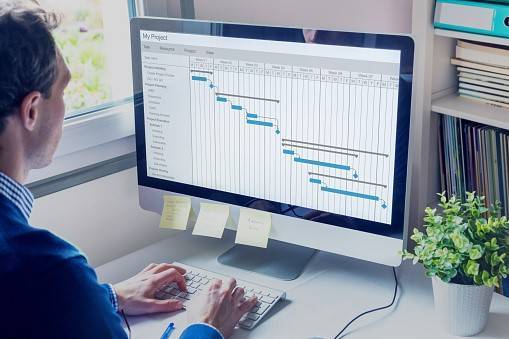
A Gantt chart is a graphical representation of a project schedule, which shows the duration of tasks as horizontal bars of varying lengths along a timeline. It is named after Henry Gantt, an American mechanical engineer and management consultant who first introduced this tool in the early 20th century. Gantt charts are used to visually display the tasks and activities required to complete a project, along with their respective start and end dates, durations, and dependencies. They provide a simple and effective way to track progress, identify potential delays, and manage resources. Gantt charts are widely used in project management across various industries, including construction, engineering, software development, and event planning.
Gantt chart examples
Here are some examples of Gantt charts:
Project Management Gantt Chart:
This type of Gantt chart is used to manage and track the progress of a project, showing the start and end dates of each task, their duration, and their dependencies.
Construction Gantt Chart:
This Gantt chart is used in the construction industry to schedule and track the progress of various construction activities, such as excavation, foundation, framing, roofing, electrical, plumbing, and finishing.
Event Planning Gantt Chart:
This Gantt chart is used in event planning to schedule and manage various tasks involved in organizing an event, such as venue selection, catering, invitations, decorations, entertainment, and logistics.
Marketing Campaign Gantt Chart:
This Gantt chart is used in marketing to plan and execute various tasks involved in a marketing campaign, such as research, content creation, design, advertising, and social media promotion.
Product Development Gantt Chart:
This Gantt chart is used in product development to schedule and manage various tasks involved in designing, testing, and launching a product, such as market research, product design, prototyping, testing, and launch planning.
These are just a few examples of the many different types of Gantt charts that can be used to visualize and manage a wide range of projects and activities.
Create a Gantt chart
I can provide you with general steps on how to create a Gantt chart:
- Identify the tasks involved in the project and list them in order of priority.
- Determine the start and end dates of each task and estimate their duration in days or weeks.
- Identify the dependencies between tasks, i.e., which tasks must be completed before others can start.
- Create a Gantt chart template in Excel or a project management software of your choice.
- Enter the task names, start dates, end dates, and duration into the Gantt chart template.
- Add dependencies between tasks by linking them with arrows or lines.
- Format the chart to make it visually appealing, such as by adding color, grid lines, and labels.
- Review the chart to ensure that it accurately reflects the project timeline and dependencies.
- Use the Gantt chart to monitor progress and make adjustments to the project schedule as needed.
How do I do a Gantt chart in Excel?
To create a Gantt chart in Excel, follow these steps:
- List the tasks involved in the project in a table. Include columns for task name, start date, end date, and duration.
- Add a column for task dependencies, if applicable.
- Select the table data and click on the “Insert” tab.
- Click on “Bar Chart” and select “Stacked Bar” chart type.
- Delete the “Legend” and “Gridlines” options in the chart to clean up the view.
- Right-click on the chart and choose “Select Data.”
- Click on “Add” under “Legend Entries (Series),” and enter the following information:
- Series name: Start Date
- Series values: Select the column with start dates
- Click on “Add” again, and enter the following information:
- Series name: Duration
- Series values: Select the column with durations
- Under “Series options,” choose a secondary axis.
- Click on “OK.”
- Right-click on the chart and choose “Select Data” again.
- Click on “Add” and enter the following information:
- Series name: End Date
- Series values: Select the column with end dates
- Under “Series options,” choose a secondary axis.
- Click on “OK.”
- Right-click on the chart and choose “Select Data” once more.
- Click on the “Duration” series and choose “Change Series Chart Type.”
- Select “Line Chart.”
- Click on “OK.”
- Add task dependencies by creating arrows between tasks. To do this, click on “Insert” and select “Shapes.” Choose the “Line Arrow” shape, draw the arrow between the two tasks, and adjust its size and position as needed.
- Format the chart to your liking by adding colors, labels, and other elements.
These steps should help you create a basic Gantt chart in Excel. Remember to review and adjust the chart as needed to ensure that it accurately reflects the project timeline and dependencies.
What Are Gantt Charts Used for?
Gantt charts are used for project management and planning. They provide a visual representation of the project schedule and help in tracking progress and ensuring that the project is completed on time. Some of the specific uses of Gantt charts include:
Project scheduling:
Gantt charts are commonly used to schedule and plan projects by breaking down the project into smaller tasks and assigning start and end dates to each task.
Resource allocation:
Gantt charts can help in identifying resource constraints and ensure that the resources are allocated efficiently to the different tasks.
Progress tracking:
Gantt charts provide a visual representation of the project progress, enabling project managers to track the status of each task and identify any delays or issues that need to be addressed.
Communication:
Gantt charts can be used to communicate project schedules and timelines to team members, stakeholders, and clients, making it easier to coordinate and collaborate.
Risk management:
By visualizing the project schedule, Gantt charts can help in identifying potential risks and developing contingency plans to mitigate them.
Overall, Gantt charts are a powerful tool for project management and planning, enabling project managers to stay organized, efficient, and on track to deliver successful projects.
What Are the Components of a Gantt Chart?
The components of a Gantt chart include:
- Task list or chart elements: This is a list of all the tasks or activities required to complete the project. It is usually displayed in a column on the left-hand side of the chart.
- Time scale: This is the horizontal axis of the chart that represents the project timeline, with the start date on the left and the end date on the right.
- Bars: The bars represent the duration of each task and are positioned along the timeline. The length of each bar corresponds to the duration of the task.
- Milestones: Milestones are significant events or achievements in the project, such as the completion of a phase or the delivery of a key deliverable. They are represented by diamonds or triangles on the Gantt chart.
- Dependencies: Dependencies show the relationships between tasks and indicate which tasks must be completed before others can start. They are usually shown as arrows linking the bars on the chart.
- Progress markers: These are used to track the progress of the project against the original schedule. They can be represented by a vertical line or shaded portion of the bar to indicate the percentage of completion.
- Legend: The legend explains the symbols used on the chart and provides a key to interpreting the Gantt chart.
Gantt chart in software engineering
In software engineering, Gantt charts are commonly used to plan and schedule project tasks and to track progress. Software development projects often involve multiple phases, including planning, design, coding, testing, and deployment, each of which can be broken down into smaller tasks. A Gantt chart can help project managers visualize the project timeline, identify dependencies between tasks, and allocate resources efficiently.
Software development teams can use Gantt charts to:
Plan the project schedule:
A Gantt chart can help teams map out the tasks involved in the project, estimate their duration, and assign them to team members. This helps ensure that all tasks are completed on time and within budget.
Identify dependencies:
Gantt charts can help teams identify tasks that are dependent on other tasks and plan accordingly. For example, coding cannot begin until the design phase is complete, so the team can plan for these tasks to occur sequentially.
Track progress:
As tasks are completed, project managers can update the Gantt chart to reflect progress. This helps teams stay on track and identify potential issues early on.
Adjust the project schedule:
If the project timeline needs to be adjusted due to unexpected delays or changes in scope, project managers can use the Gantt chart to re-allocate resources and adjust task durations.
Overall, Gantt charts are a useful tool in software engineering for project planning and management, helping teams to stay organized and on track.
Gantt chart in project management
Gantt charts are widely used in project management as a tool for planning and tracking project schedules. In project management, a Gantt chart is a visual representation of a project schedule that displays all of the tasks involved in the project, along with their start and end dates, duration, and dependencies. Here are some ways Gantt charts can be useful in project management:
Planning the project:
Gantt charts help project managers plan out the entire project by breaking it down into individual tasks, estimating the duration of each task, and identifying dependencies between tasks.
Allocating resources:
Once the tasks have been identified, Gantt charts can be used to allocate resources, such as staff, equipment, and materials, to each task.
Tracking progress:
Gantt charts help project managers track progress by showing the current status of each task, including whether it is on schedule, behind schedule, or completed.
Identifying potential issues:
By showing dependencies between tasks, Gantt charts help project managers identify potential issues and bottlenecks in the project schedule. This allows managers to make adjustments to the schedule as needed to keep the project on track.
Communicating with stakeholders:
Gantt charts can be used to communicate the project schedule to stakeholders, such as clients, team members, and upper management. This helps ensure that everyone is on the same page and understands the timeline for the project.
Overall, Gantt charts are a useful tool in project management for planning, tracking, and communicating the project schedule.
Gantt chart in project management pdf
Gantt charts are widely used in project management and can be created and saved as a PDF document for easy sharing and distribution. Here are the steps to create a Gantt chart in project management as a PDF:
- Open a Gantt chart template or create a new one in project management software such as Microsoft Project, Smartsheet, or Asana.
- Enter the project tasks, durations, and dependencies into the Gantt chart template.
- Format the Gantt chart to make it easy to read and understand. This may include changing the font size, color-coding the tasks, and adding labels or legends.
- Save the Gantt chart as a PDF document. In most project management software, this can be done by selecting “Export” or “Save as PDF” from the File menu.
- Review the PDF document to ensure that it accurately reflects the project schedule and is easy to read and understand.
- Share the PDF document with stakeholders, such as clients, team members, and upper management. This can be done via email or by uploading the document to a shared drive or project management platform.
Overall, creating a Gantt chart in project management as a PDF document is a simple and effective way to share and distribute the project schedule with stakeholders.
Gantt chart example for project Proposal
Here is an example of a Gantt chart for a project proposal:
| Task | Start Date | End Date | Duration | Predecessors |
| Conduct Needs Assessment | 01/01/2023 | 01/14/2023 | 10 days | – |
| Develop Project Plan | 01/15/2023 | 01/21/2023 | 5 days | 1 |
| Define Project Scope | 01/22/2023 | 01/28/2023 | 5 days | 1 |
| Develop Project Budget | 01/29/2023 | 02/04/2023 | 5 days | 1 |
| Write Project Proposal | 02/05/2023 | 02/18/2023 | 10 days | 2, 3, 4 |
| Review and Edit Project Proposal | 02/19/2023 | 02/25/2023 | 5 days | 5 |
| Submit Proposal | 02/26/2023 | 02/26/2023 | 1 day | 6 |
- In this example, the project proposal development process is broken down into six tasks. The first task is to conduct a needs assessment, which takes 10 days. The remaining tasks are dependent on the completion of the first task.
- The second, third, and fourth tasks are to develop the project plan, define the project scope, and develop the project budget, respectively. Each of these tasks takes five days and can be done in parallel.
- Once these three tasks are complete, the team can begin writing the project proposal. This task takes 10 days and is dependent on the completion of the previous three tasks.
- Once the proposal is written, it must be reviewed and edited. This task takes five days and is dependent on the completion of the writing task.
- Finally, the completed proposal is submitted on the last day of the project. The Gantt chart shows that the entire project takes 56 days, from January 1, 2023, to February 26, 2023.
Gantt chart exercises with answers
Here are some Gantt chart exercises with answers:
Exercise 1:
Task A takes 5 days to complete. Task B depends on Task A and takes 10 days to complete. Task C depends on both Task A and Task B and takes 7 days to complete. Create a Gantt chart for this project.
Answer:
| Task | Start Date | End Date | Duration | Predecessors |
| A | 01/01/2023 | 01/05/2023 | 5 days | – |
| B | 01/06/2023 | 01/17/2023 | 10 days | 1 |
| C | 01/18/2023 | 01/26/2023 | 7 days | 1, 2 |
Exercise 2:
Task A takes 3 days to complete. Task B depends on Task A and takes 7 days to complete. Task C depends on both Task A and Task B and takes 5 days to complete. Task D depends on Task B and takes 4 days to complete. Create a Gantt chart for this project.
| Task | Start Date | End Date | Duration | Predecessors |
| A | 01/01/2023 | 01/03/2023 | 3 days | – |
| B | 01/04/2023 | 01/11/2023 | 7 days | 1 |
| C | 01/12/2023 | 01/18/2023 | 5 days | 1, 2 |
| D | 01/12/2023 | 01/17/2023 | 4 days | 2 |
Exercise 3:
Task A takes 2 days to complete. Task B depends on Task A and takes 6 days to complete. Task C depends on Task B and takes 4 days to complete. Task D depends on Task C and takes 5 days to complete. Create a Gantt chart for this project.
Answer:
| Task | Start Date | End Date | Duration | Predecessors |
| A | 01/01/2023 | 01/02/2023 | 2 days | – |
| B | 01/03/2023 | 01/08/2023 | 6 days | 1 |
| C | 01/09/2023 | 01/12/2023 | 4 days | 2 |
| D | 01/13/2023 | 01/18/2023 | 5 days | 3 |
Pros and cons of gantt chart
Pros of Gantt charts:
- Visualization: Gantt charts provide a visual representation of project tasks, timelines, and dependencies, making it easier to understand and manage project schedules.
- Planning and scheduling: Gantt charts enable project managers to break down complex projects into smaller tasks, assign deadlines and allocate resources efficiently.
- Communication: Gantt charts are an effective communication tool, allowing project managers to share project schedules and timelines with stakeholders, team members, and clients.
- Progress tracking: Gantt charts enable project managers to track progress and identify delays or issues that need to be addressed.
- Flexibility: Gantt charts can be modified easily as project timelines or requirements change, making them a flexible project management tool.
Cons of Gantt charts:
- Time-consuming: Creating and maintaining a Gantt chart can be time-consuming, especially for complex projects.
- Lack of detail: Gantt charts provide an overview of the project timeline, but they may not provide enough detail for some projects or industries.
- Complexity: Gantt charts can become complex if there are many tasks, dependencies, and milestones to manage.
- Limited collaboration: Gantt charts are primarily designed for top-down project management, which can limit collaboration and teamwork.
- Lack of real-time updates: Gantt charts may not reflect real-time updates, making it difficult to track progress in real-time.
Overall, Gantt charts are a useful tool for project management, but they have their limitations. They work best when used as part of a larger project management system that includes collaboration tools, task management software, and other project management tools.
Frequently asked questions
Here are some frequently asked questions about Gantt charts:
Q.1 What is a Gantt chart?
A Gantt chart is a bar chart that displays the tasks or activities required to complete a project, the start and end dates for each task, and the dependencies between tasks. Gantt charts provide a visual representation of the project schedule and are used for project planning and management.
Q.2 Who invented the Gantt chart?
Henry Gantt, an American mechanical engineer, invented the Gantt chart in the early 20th century. He created the chart as a tool for project scheduling and management.
Q.3 What are the benefits of using a Gantt chart?
Some of the benefits of using a Gantt chart include better project planning, improved communication, enhanced visualization of project timelines, better resource allocation, and easier tracking of project progress.
Q.4 How do I create a Gantt chart?
There are several ways to create a Gantt chart, including using specialized software such as Microsoft Project or Excel, or online project management tools such as Asana or Trello. You can also create a Gantt chart manually using pen and paper or a whiteboard.
Q.5 What are the limitations of a Gantt chart?
Some limitations of Gantt charts include the time-consuming nature of creating and maintaining them, the lack of real-time updates, the complexity of managing many tasks and dependencies, and the limited collaboration features.
Q.6 Can Gantt charts be used for agile project management?
Yes, Gantt charts can be used for agile project management by using agile-specific tools and practices. For example, some project management software allows you to create Gantt charts that incorporate sprints and agile iterations, making them a useful tool for agile project management.
In conclusion
In conclusion, a Gantt chart is a useful tool for project planning and management. It provides a visual representation of project schedules, timelines, and dependencies, making it easier to manage project tasks and allocate resources efficiently. However, it’s important to note that Gantt charts have their limitations, including the time-consuming nature of creating and maintaining them, the lack of real-time updates, and the limited collaboration features. To maximize the benefits of Gantt charts, it’s best to use them as part of a larger project management system that includes collaboration tools, task management software, and other project management tools.